Sub-tropical Indian Ocean Dipole (SIOD)
Latest observations and forecasts for SIOD
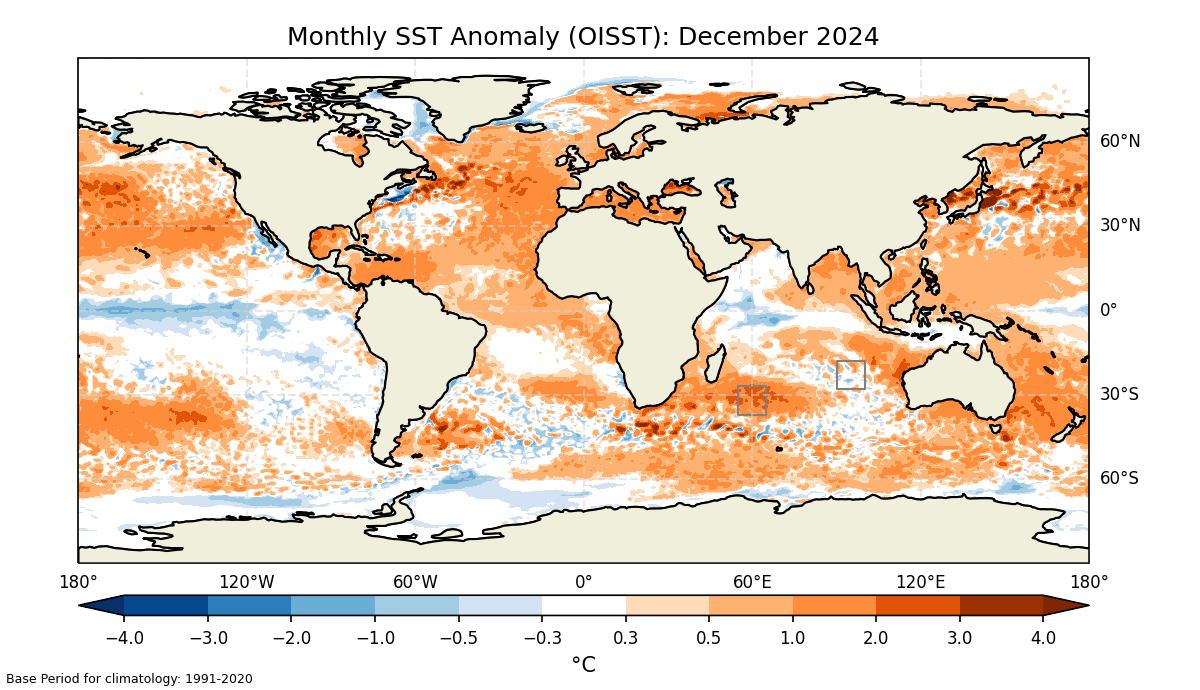
Observed SST map

This map shows the latest monthly Sea Surface Temperatures (SST) produced, using OISST data. The grey boxes seen in the southern Indian Ocean (west of Madagscar) show the ocean areas monitored for tracking the SIOD. SST anomalies are averaged separately over the box on the left (the western pole) and the box on the right (the eastern pole).
SIOD is then calculated as the difference between the western pole anomaly and the eastern pole anomaly.
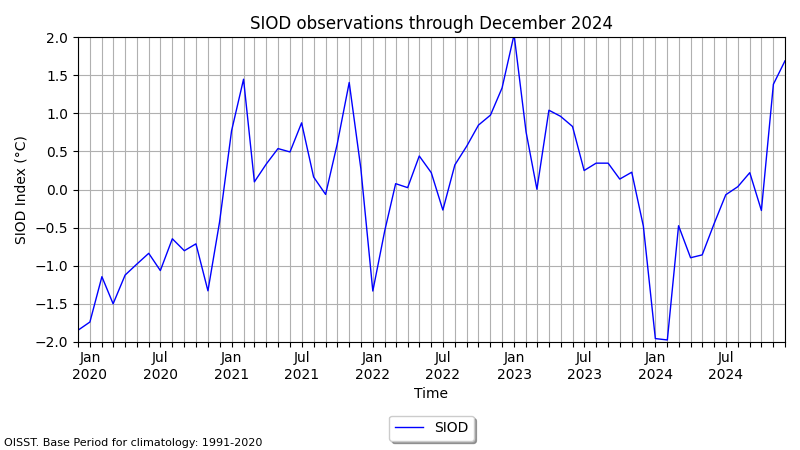
SIOD Observations Graph

This graph is produced using the latest OISST monthly sea surface temperature observations, and shows the SIOD for the latest monthly observations, tracking back through the last 60 months.
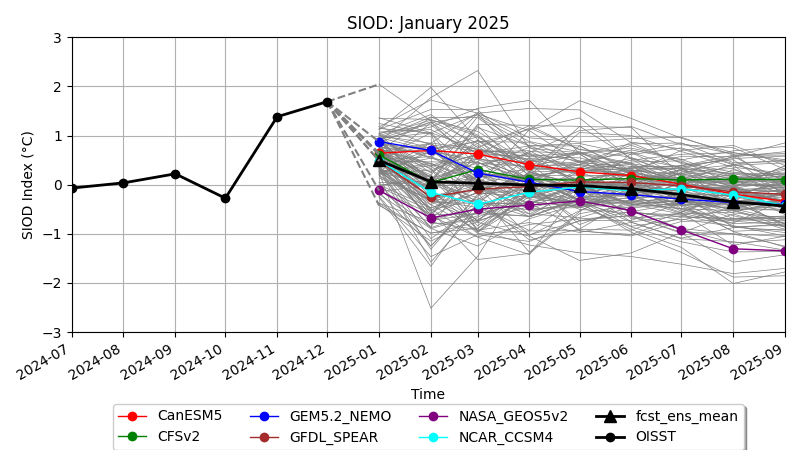
SIOD Forecast Graph

This graph is produced using the latest OISST monthly sea surface temperature observations and NMME seasonal model forecasts. The black line with circle markers shows the progression of observed OISST sea surface temperatures over the past few months. The grey lines show the forecast progression of the SIOD from the current month for the next few months, for each of the ensemble members from the NMME models. The coloured lines show the average of the forecast SIOD for each model in the NMME, e.g. green for CFSv2, cyan for NCAR CCSM4 etc
The SIOD is related to rainfall in parts of southern Africa, with a positive SIOD tending to be associated with above-average rainfall, while a negative SIOD tends to be associated with below average rainfall in some areas. Other factors also play an important role however, such as the El Nino Southern Oscillation (ENSO), and local and regional weather systems. Monitoring the SIOD is important because of the potential influence on southern Africa rainfall.
Background
The data processing and analyses on this page are provided by Tamuka Magadzire as an experimental project. I started developing this SIOD
analysis and web page as I could not find websites that gave detailed up-to-date information on the SIOD. In this set up, I am using Python to automatically download observed and forecast SST data every month, process the data, and produce the SIOD graphics which are automatically updated and posted to this web
page.
The data and resources provided here are experimental, for interest purposes only, they should not be considered as official forecasts or advisory,
and should not be used for decision making. Always seek guidance from official and reputable climate forecasting agencies to guide any climate-related
decision making. Feel free to contact me for more information and discussions about the SIOD.